
Mapping Tool
Interactive tool that visualize data by creating a color-coded map to view the distribution of scores for an indicator around the world.
The V-Dem Graphing Tools is a platform for making data visualization intuitive, accessible and easy to use. Here you find user-friendly tools specially designed to visualize V-Dem data in various forms depending on your needs and interest. Select one of the tools to start exploring the data.
Interactive tool that visualize data by creating a color-coded map to view the distribution of scores for an indicator around the world.

Compares multiple countries for one indicator/or index. Select one indicator and multiple countries/regions. The data are aggregated by year.

Compares multiple variables/indices for one country/region. Select one country/region and multiple indicators/indices. The data are aggregated by year.

This tool displays multiple variables and indices for one country/region in a radar chart. Select one country/region and multiple indicators/indices.

This tool displays multiple countries (three or more) for one indicator/index in a radar chart. Select one indicator/index and multiple countries.
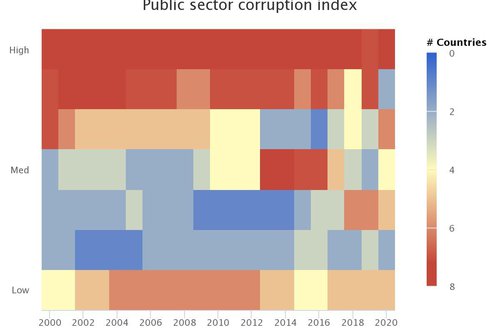
This tool displays one indicator/index on a heat map - a graphical representation of data where values are represented by colors.

This tool displays the development of a V-Dem indicator/index in a region between two selected years.

By utilizing novel sequencing methods, this tool shows sequencing relationships between indicators in a selected category with a comparison between country vs. region.

The tool is based on novel sequencing methods, data analysis and scenario modeling, and can explain which indicators should be developed in order to reach progress in a selected category.

The Predicting Adverse Regime Transitions (PART) project uses V-Dem data and other sources to estimate the risk of adverse regime transitions during the next two years.

The Democratic Space Barometer estimates the probability that a country will experience at least one opening event (shift towards more democratic governance) or at least one closing event (shift towards more autocratic governance) within a two-year window.

The Pandemic Backsliding Project tracks state responses to Covid-19 and their potential effect on the overall quality of democracy within the country. The current version of the data reflects the situation between March 2020 and June 2021.

Varieties of Party Identity and Organization (V-Party) examines the policy positions and organizational structures of political parties across the world.
All V-Dem data and graphs generated by the online tools is an open source and free for anyone to use. You do not need to seek permission to use the data, but we kindly ask you to cite the data:
Coppedge, Michael, John Gerring, Carl Henrik Knutsen, Staffan I. Lindberg, Jan Teorell, David Altman, Fabio Angiolillo, Michael Bernhard, Agnes Cornell, M. Steven Fish, Linnea Fox, Lisa Gastaldi, Haakon Gjerlöw, Adam Glynn, Ana Good God, Sandra Grahn, Allen Hicken, Katrin Kinzelbach, Joshua Krusell, Kyle L. Marquardt, Kelly McMann, Valeriya Mechkova, Juraj Medzihorsky, Natalia Natsika, Anja Neundorf, Pamela Paxton, Daniel Pemstein, Johannes von Römer, Brigitte Seim, Rachel Sigman, Svend-Erik Skaaning, Jeffrey Staton, Aksel Sundström, Marcus Tannenberg, Eitan Tzelgov, Yi-ting Wang, Felix Wiebrecht, Tore Wig, Steven Wilson, and Daniel Ziblatt. 2025. "V-Dem Country-Year Dataset v15" Varieties of Democracy (V-Dem) Project. https://doi.org/10.23696/vdemds25
V-Dem is part of and partly funded by DEMSCORE, national research infrastructure grant 2021-00162 from the Swedish Research Council. The simulations and other computational tasks were enabled by resources provided by the National Academic Infrastructure for Supercomputing in Sweden (NAISS), partially funded by the Swedish Research Council through grant agreement no. 2022-06725.

